Alright, for the dozen of people who care, here's my final projections for the 2023 Ontario Liberals' leadership race. The voting is happening this weekend and results will be unveiled on December 2nd.

As usual with leadership races, I make the assumption that fundraising data is the best data available. This has worked remarkably well on a few occasions. I pretty much nailed the CPC 2022 race, while I was alright but less close in 2020 (had O'Toole winning on my last update on Twitter) or 2017 (I had Bernier ultimately winning; Note: both 'errors' mostly were caused by Quebec with its really low number of members). I was also very successful in two PQ races in Quebec, in 2020 but particular in 2016 where polls all had Cloutier as favorite.

Leadership races are weird. We usually don't get good polls (except maybe for the CPC races where Mainstreet manages to get the membership list), rules are weird (points per riding, etc) and turnout is often low. So while I really like covering such races, keep in mind that projections are less accurate than for regular elections.

Alright, with this behind us, here are my projections for the OLP race.
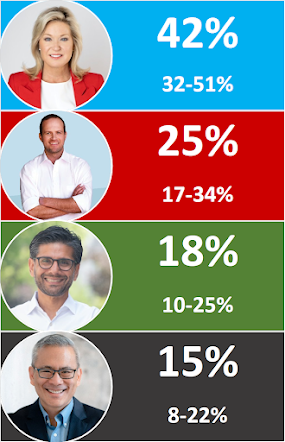


Yes the intervals are large. I looked at my accuracy over 5 leadership races and it told me that while I was 4-5% off in average, the correct margins of error to represent the full uncertainty were around 10% (for a candidate at 50%, less for candidates that are lower). It's not an attempt by me to cover my ass, it simply represents the fact that leadership races are hard to call.

Bonnie Crombie is the favorite but the uncertainty is such that all four candidates have a path. Some paths are just narrower than others. In order of certainty, I'd say this:

1) Crombie will be first after the first round

2) Nate Erskine-Smith will finish 2nd after the first round and face Crombie in the final round

3) Crombie will win

I wouldn't put a lot of money down on my third call though.


The data

I have used is a mix of the fundraising from Elections Ontario as well as data from Google Trends. The last one might seem stupid but it has proven to work remarkably well in previous races. For the fundraising data, I did an average of the (unique) number of donors (both over the entire race as well as since September 1st) and the amounts collected. I give a much bigger weight to the number of donors as one vote is one vote, no matter if the person donated $200 or $1000. With that being said, higher amounts usually indicate support among older voters and their turnout is stronger, so I wanted to use this part of the data. If you want to know the details, I gave the number of donors a weight of 50% while the number of donors since September got 25% (the candidates could only sign new members until September 5th, thus the Sept. cutoff in my calculations; It's simply a way to measure the late momentum) and the total amounts collected got the last 25%. As for how I mixed Google Trends, I did a 75-25 average (75 on the fundraising). The weights are mostly 'vibes'. I don't believe the exact weights matter, I just want to mix all the data available. Again, leadership races are just harder to predict and my experience has been that mixing works best.

Important details: we only get the data for donations over $200. I suspect that Nate Erskine-Smith has more donations under $200 than Crombie as he's targeting young voters.

Google Trends is interesting as Bonnie Crombie has been crushing it there from the start and Nate has been surprisingly bad on this metric. Yes Google Trends is mostly a popularity contest but so are leadership races.

Crombie's lead, depending on the metric, goes from 30 points (Google Trends) to being tied (number of unique donors since September; She is actually 3 donors behind Nate! He definitely had the momentum at the end). She also has the lead when it comes to new members signed, although not all campaigns reported numbers (Crombie said 38,700, Naqvi said 31k and Shamji, before dropping and endorsing Crombie, said 12,063. I don't believe Hsu and Erskine have revealed numbers. The party has said there were 103k members total, so assuming Crombie, Naqvi and Shamji told the truth, Erskine and Hsu add up to 21k. This seems low for Erskine but there is likely a reason why he said he "wouldn't play the number game" and didn't reveal his numbers. You don't do that when your numbers are good. Just ask Jean Charest!

Finally, Crombie has been leading in the polls by huge margins, but it's among OLP voters, not members.


Second choices

Out of the 2516 donations, 207 were from people who donated more than once (including 93 people who donated to more than one campaign). Using donations by the same person to multiple campaigns, I got the following pairing table. It's based on so few observations that I don't feel confident using it to make projections past the first round.
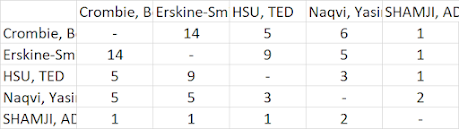


I'll say one thing: I think the narrative online that Crombie has no down ballot support among the other three candidates is not consistent with the data. I wouldn't be surprised if this were a Twitter-isn't-real-life thing. I'm also very curious as to how effective the deal between Erskine and Naqvi will be. We remember how Kennedy delivered his delegates to Dion in 2007 but that was during a convention, very different. In a related manner, how much of the Shamji endorsement will be useful to Crombie? Hard to say.

The huge uncertainty (complete lack of info really) regarding second choices is really what is preventing me from making a more official call. I believe Crombie will be ahead after the first round (even though I'm not sure if it'll be by a lot or a little), I believe Nate will face her in the final round but I can't really tell how Hsu and Naqvi supporters will vote once their preferred candidate is eliminated. My intuition tells me that Crombie better have a strong lead after the first if she doesn't want to become the next Bernier or MacKay, but I suspect the lead required is less important than some on Twitter would like you to believe.
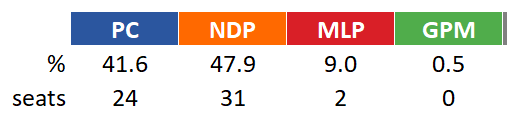
I haven't covered much of the Manitoba election except for a few tweets on Twitter before I got permanently suspended. Still, here are the final projections. Please keep in mind that I spent a LOT less time following this election and building the model than for other elections. I also know nothing of Manitoba and its politics. Finally, we got very few polls (although the trend is similar across polls and they seem to agree on the NDP being well ahead).


If you don't tryst the polls, just use the simulator here.


Final projections based (note: I'll update if we get more polls before midnight and if these polls significantly shift my projections):


I didn't build a probabilistic model so I don't have the exact chances for each party but given that I don't find a strong imbalance between popular vote and seats, a PC victory would require a significant polling error. Basically the PC needs to do 3 points better and the NDP 3 points worse. The odds of such an error are 10%.

Another way to look at it is to notice that the PC basically needs a clean sweep of the close races (within 5%) to win 28 seats (and even there, NDP+Lib would be above...). Such a scenario would, once again, require a systematic polling error in the favour of the PC. Could vote efficiency save Stefanson? Maybe but she needs to expect the Liberals to either split the vote more or switch to her. All in all, it's pretty clear the safe bet is on a NDP majority tomorrow. Any other result would be a pretty bug surprise.

The NDP dominates in Winnipeg while the PC rules the rest of the province. However, the NDP is closer in the rest (10 points behind) than the PC is in Winnipeg (20 points behind). Northern Manitoba is also a huge source of rural seats for the NDP.

Ultimately, and keep in mind that I don't follow that much, but it seems to me that Stefanson failed to do what Danielle Smith did in Alberta: win the campaign (and the debate). The PC campaign hasn't been as good as the Smith's one and Stefanson didn't win the debate (Smith absolutely crushed it). To Stafanson's credit, it seems Manitoba doesn't have a Calgary, that is a conservative leaning city. We have seen at the federal level (both elections and polls) that Manitoba is shifting left and this is mostly driven by Winnipeg.

Manitoba follows Alberta in one way though: the left now seems united. The Green party has essentially disappeared and the Liberals will likely finish below 10%. It's impressive to see how the modern Left in Canada is willing to unite despite disagreements. Well in Manitoba, Alberta and BC, not in Ontario...

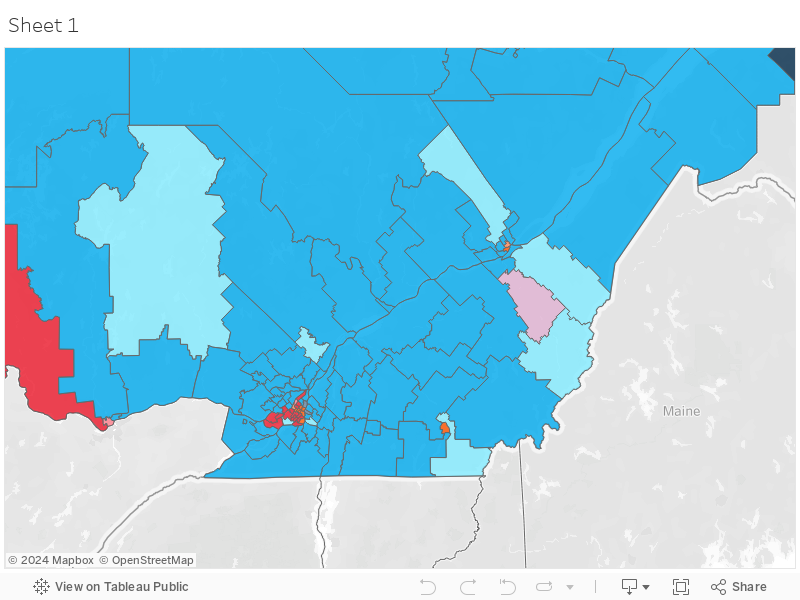
Here are the maps as well as the detailed projections by ridings.


Winnipeg


While it looked like this Alberta could become a really close one, the reality after a full campaign is that there is a clear favorite: Danielle Smith and the UCP. Her chances aren't 100% but they are high enough for me to make a confident call. If you feel my polling average is wrong, just use your own numbers in the simulator. Also follow me on Twitter for more updates and data.


The NDP does have a chance but it's a very narrow path to 44 seats. Basically they would need to sweep all the projected close races in Calgary. That either requires an incredible vote efficiency and/or an underestimation by the polls. Given Alberta, the latter is quite unlikely. It's not impossible though and some polls (the ThinkHQ one for Calgary or the Mainstreet riding polls in the same city) have shown situations where the NDP was at +6 to +11 in the city and that could be enough to win 44+ seats. Forum released a poll late tonight and they had the NDP +2 in the CMA. That would likely mean +6-7 in the city. Their seat projections? 45 UCP, 42 NDP. My model is the same, if I modify the numbers to boost the NDP by 2 points in the Calgary CMA and decrease the UCP by 2, I get 44-43.


The math here shows two things. First, the regional polling average is such that the UCP is still leading in the Calgary region. And that means a UCP government. The NDP cannot win the election without winning in Calgary overall. Secondly, even if the polls are off by 4 points in total, I still think the UCP wins! So again, a surprise is possible but is far from likely. Especially since polls in Alberta have had a strong tendency to underestimate the Conservatives (5 points in 2019 and 2021; almost as much in 2015).


The real uncertainty is more about the size of the UCP majority. There are so many close races in Calgary, all with their own variables (candidates, demographics, etc) that it's not really possible to be sure what will happen. The difference between being right or wrong in your projections could very well come down to luck. I'd say that any result between 45-52 for the UCP would not surprise me. The confidence intervals you see below are at 95% confidence. If I were to reduce to 50% confidence, you indeed get 45-52. It only takes a few points in Calgary for the projections and the map to look very different. But it takes quite a polling miss for a NDP win.


This campaign didn't turn out to be a very interesting one in my opinion. The NDP failed to make a case as to why people should fire Smith beyond a few scandals here and there. They never successfully made the case Albertans would be better off under a NDP government. There was a time in the middle of the campaign where things looked to go the NDP way but it didn't last very long. Smith winning the debate also helped a lot, especially since Google Trends seem to indicate people paid the most attention during that time.


One odd thing with polls has been their tendency to see the NDP doing relatively well in the rest of Alberta (sometimes as high as 40%!; they got 21% in 2019) while the UCP is showing good numbers in Edmonton. My projections have Lesser Slave Lake close but I don't believe my projections (but hey, that's what the model says) and the NDP winning Lethbridge East. The UCP is holding strong in the Edmonton ring/donut and I know some UCP members are convinced they'll actually win seats in Edmonton. I doubt it but look at the South of the city if you are looking for a surprise.


Ultimately it comes down to Calgary and, as mentioned before, the polls are simply not showing the lead the NDP needs. Polls have been all over the place there but that would be consistent with the UCP and NDP being close to each other. I have worked a lot harder on Calgary. I looked at the areas that went left between 2019 and 2021 (federal level). I have made adjustments based on quadrants from the few polls we got. Still, as I mentioned previously, it's hard to be super confident on any close races.


So anyway, here are the projections. Thank you for following me (mostly on Twitter these days) and I hope you enjoyed the coverage of this election. It sure was more interesting than the Ontario and Quebec ones!


The map

Interactive version here.


Detailed projections:


Whenever I give an interview and am asked about my model, I always say the same thing: the most important variable to get right is the popular vote. If you nail the percentages for each party in a province, you are 90% there. People always believe most of my work is from building the model. It's not wrong in that it is where I spend most of my time, but it isn't the most important part. Put it another way: a simple model with the right percentages as inputs will do better than a 'sophisticated' model with demographics and what not but the incorrect percentages.


Why am I talking about this? Because for this Alberta election, the percentages you get depend on how you look at the polls. Let me explain. First of all, it is well known that polls in Alberta tend to underestimate the Conservatives. It was the case in 2019 (see below) and even in 2015 (even though nobody really noticed). It was also the case at the federal level in 2021 (more than 5 points underestimation for the Tories). Part of it is likely caused by turnout where older voters vote more. To deal with this issue, I already allocated a majority of undecided voters to the UCP. In this election, I allocate 60% to the UCP and 40% to the NDP. This alone makes the UCP's lead, province-wide, move from +1.8 to +2.9.


Performance of polls in Alberta in 2019


But there is something weirder this time. Polls, in general, are not internally consistent. When you take the raw polling average of the province-wide numbers, you currently get 47.3% vs 45.5%. But if you instead take the average by regions (Calgary, Edmonton and the rest) and you then average those 3 numbers (with the correct weights to reflect the number of voters in each region), you get 49.4% vs 43.4% (that is without adjusting the undecided, just the raw average of the numbers by regions as given by the pollsters).


It doesn't make sense and something must be off with the weights of some pollsters. The more ridiculous example of this is the most recent poll by Research Co. They have the UCP winning the rest of Alberta 63-31, losing Edmonton 35-61 (so it basically cancels out but the UCP still should have an edge) and then the UCP wins Calgary 52-44. Surely the UCP should be ahead province-wide, right? Average 52, 35 and 63 and that's higher than 44, 31 and 61, right? Nope! Research Co has the NDP winning the province 49-47! It makes no mathematical sense. It just can't be. Research Co is an extreme example but we have the same issue overall it seems.


So I'm now left with a decision: do I use the province-wide numbers as main inputs like I usually like (more accurate). After adjusting for the undecided and the lack of candidates for some parties, that would give me 49-46. Or I use the average of the 3 regions and that gives me (after adjustments), 51-44. (Note: no matter which province-wide numbers I use as input, I still make further adjustments to match the regional numbers; Right now it means increasing the NDP in Calgary as they seem up more than in the rest of the province).


You might think that 49-46 vs 51-44 isn't a big deal. Wrong! That's the difference between 43-44 projections and 50-37! It's really all because of Calgary, a few points can shift 5-6 seats. Since the riding polls are more consistent with the 51-44 scenario, I decided to use do an average and use 50-45 as my input. But yes, it does mean I'm quite far from a raw polling average. But at least I explain my reasoning and steps.


So, with the new numbers, here are the projections. They changed a lot from my recent ones on Twitter and I usually don't like this. But the permanent internal inconsistencies have convinced me I needed to do something. I might be wrong and the popular vote will be much closer. But that's a risk I'm willing to take.


The NDP still has a chance but it'll require the 'Mainstreet scenario' of winning Calgary by like 6-8 points. Other pollsters don't have such a lead. Ultimately 22% chances of winning align well with my subjective reading of the race. I think the NDP has better chances in Calgary Bow (strong candidate) and maybe in Elbow. Then add Lethbridge East and Morinville-St. Albert and that's 41. But right now, it's hard for me to see the NDP go over 41-42 seats unless polls were quite off in Calgary.


After a difficult week for Danielle Smith (multiple controversies and scandals), the recent polls have started to show a shift towards the NDP. The Abacus poll yesterday had the NDP ahead by 11 (!) province-wide while the (for subscribers only) Mainstreet numbers have the UCP ahead overall but trailing significantly in Calgary.


I still have other, older polls in my average (Leger, ThinkHQ, etc) but my projections now show a race that is literally too close to call. Now, let's be clear, polls in Alberta have had a strong tendency to underestimate the PC/UCP, so it's possible Smith is still favored. But I technically do partially account for this by allocating more undecided to the UCP.


I'd like to address the weird result where the NDP is ahead in the seat count but has lower chances of winning. This isn't a mistake. This is because the NDP is currently projected to win 6 out of 8 close races in Calgary. When I run simulations, I have some with the NDP beating its poll numbers while other simulations will have this party below. What is happening here is that if we look at what would happen if the NDP did better than the polls, it doesn't change much. The NDP is already winning basically everything it can. But if the we look at scenarios where the UCP beats the polls, then the UCP swings back to 48-49 seats. So overall, if we account for the uncertainty that exists, the UCP is still slightly favored.


The map


Interactive version here.


These days, I post a lot more on Twitter than on my site, so follow me there for more updates. Still, it's good to have posts on the site with updates throughout the election. So here's a quick post as a starting point for the 2023 Alberta election.


The polls have been better for the UCP over the last few months (after Kenney left and Danielle Smith took over) but it remains a dead heat for the popular vote. With that said, let's remember that polls have a strong tendency to underestimate the PC/UCP and overestimate the NDP in Alberta. In 2019, the polls were actually quite off, especially in the rest of Alberta. I do a simple average of the polls (no fancy weights based on the so-called reliability of the polling firm of whether the sample is a little bit bigger; It's all a waste of time as I have systematically got a better polling average than sites who use such fancy techniques) but I don't allocate undecided proportionally. I have talked extensively about this, but long story short, polls tend to underestimate incumbents and large parties. So, right now, I'm giving 60% of undecided to the UCP and 40% to the NDP. I might change that during the campaign but it makes the most sense to me right now.


As for the model, I use a simple uniform swing because it works great. I do make adjustments per region to account for within-province realignments. Right now, the provincial swing slightly underestimates the NDP in Calgary but overestimates it in Edmonton. You can always make your own adjustments in the simulator. One 'fancy' technique I'm using is I used the 2019 to 2021 swing at the federal level and I identified 7 ridings where the LPC+NDP swing was much higher (and the CPC decreased more). They are Calgary Cross, East, Falconridge, Foothills, McCall, North and North-East. I assume that this means these ridings are turning more progressive and I therefore adjust the NDP more. Yes provincial and federal politics aren't the same but the ridings identified here makes sense.


Anyway, here are the projections with the map and the riding by riding projections. It's close in the sense that a typical poling error could result in a NDP victory, but the UCP is clearly favored. See it this way, for the NDP to win, it needs to basically win 19 in Calgary (versus only 3 in 2019...). It could win 17 or 18 and make 1-2 extra gains in the Edmonton donuts (or win Lesser Slave Lake in the rest of Alberta). It's a path but it's a narrow one with basically no mistake allowed. I personally think that unless the NDP starts polling clearly ahead in Calgary (and it isn't right now), the UCP will prevail. But the simple fact that the UNITED Conservatives have 'only' a 72% chance of winning is pretty crazy.


Interactive version here: https://public.tableau.com/app/profile/bryan.breguet/viz/Albertaprojections2023/Sheet1

Riding by riding can be found here or click on the picture below.


Il y a 4 ans, plusieurs doutaient que Legault puisse gagner sa majorité. Je me souviens avoir un de ceux qui étaient le plus confiant dans mes projections finales. J'vai eu raison même si j'avais moi-même sous-estimé la CAQ (en partie car les sondages avaient été très mauvais). Pas d'incertitude cette année. Cette élection n'aura au final quasi rien changé et Legault va aller gagner sa super majorité avec environ 40% des votes. La seule question est vraiment de savoir s'il aura 100 sièges ou moins.


Pour ceux qui n'ont pas le temps, voici les projections et la carte. Mon analyse suit.


La carte


Et les projections comté par comté.


Prime à l'urne?

On connait bien ce terme qui, d'habitude, permettait au PLQ de faire mieux que prévu. Ce ne fût pas le cas en 2018 (c'est tout le contraire) et ce ne sera probablement pas le cas demain. Dans les faits, le PLQ a un risque réel de scénario catastrophe où son vote (surtout anglo) ne sort pas et se retrouve à 10-13 sièges. On pourrait même imaginer un scénario où QS finit opposition officielle. Si vous regardez le dernier sondage Mainstreet (page 23), vous voyez que les électeurs Libéraux sont les moins sûrs d'aller voter. Aussi, le PLQ avait en général une prime à l'urne grâce au vote des 65 et plus qui avaient peur d'un référendum. La menace n'est plus là et c'est la CAQ qui domine outrageusement dans cette catégorie d'âge. Finalement, si on regarde les sondages par comtés et on les aggrège pour faire des projections (une méthode qui avait mieux marché en 2018), on obtient le PLQ vers les 12-13%!


Tout cela pour dire que demain soir, si mes projections devaient être dans l'erreur, je soupçonne que ce serait en raison d'un effondrement du PLQ dû à une faible participation. Et si prime à l'urne il y a, je parie sur la CAQ au-dessus de 40%. Les sondages de fin de campagne s'entendaient plutôt bien pour placer la CAQ vers les 38-41%, mais il y en a eu d'autres, plus anciens (Angus-Reid, Ekos), qui avaient ce parti significativement plus bas. Et le Forum de dernière minute n'avait ce parti qu'à 36.8%. Il n'y a ainsi pas un consensus total (à l'inverse de l'élection en Ontario plus tôt cette année).


Si le scénario catastrophe devait se produire, le PLQ ne conserverait que ses châteaux forts dans l'ouest de l'île et parfois avec de petites majorités. Mais les comtés comme SHSA, Hull ou encore Bourassa-Sauvé changeraient de couleur.


Le PQ

Le PQ est le seul parti qui termine cette élection plus élevé qu'au début. Le problème c'est que le PQ reste très bas et son vote est encore plus inefficace. En 2018, il pouvait au moins compter sur de grands noms pour gagner des comtés (Jonquière, Joliette, etc). Pas cette année. Bérubé est garanti de gagner mais après, cela pourrait être le naufrage. D'autant plus que les sondages ont montré un vote PQ qui montait dans la région de Québec. C'est pour les pourcentages de votes mais c'est complètement inutile en sièges.


Si PSPP gagne dans Camille-Laurin/Bourget, cela sera grâce à sa bonne campagne (tout le monde s'entend là-dessus) mais aussi grâce à la candidate QS qui a été idiote et a volé ce pamphlet électoral. Sans cet évènement, j'aurais le PQ à un siège.


J'ai le PQ gagnant dans Marie-Victorin, c'est un peu étrange je l'avoue mais j'ai utilisé ma méthode habituelle pour tenir compte des partielles et c'est ça que j'obtiens. Aussi le candidat Péquiste est un ancien député fédéral, donc il peut aider.


Le PCQ et le mode de scrutin

Le PCQ est peut-être né de la crise sanitaire, mais force est d'admettre que ce parti semble plus solide que prévu. Son problème principal est que son vote n'est en fait pas assez concentré! Il gaspille trop de votes un peu partout au lieu de tout concentrer dans la région de Québec. Les sondages ont quasiment tous montré la CAQ confortablement devant dans cette région. Il y a eu un seul sondage par comté qui a montré le PCQ en tête dans Beauce-Nord. Dans Chauveau, deux firmes différentes ont montré la même chose: Duhaime tirant de l'arrière.


Y a-t-il un espoir pour le PCQ? Oui. La participation par anticipation semble indiquer une forte hausse dans Beauce-Nord, Bellechasse et Chauveau. Cela est de bon augure pour Duhaime et ses candidats.Il y a le Forum, publié tard hier soir, qui montrait le PCQ devant dans la région de Québec. Le sondage Ekos avait aussi une course bien plus compétitive. Donc il se peut que ce parti soit sous-estimé. Au final cependant, je me dois de suivre les données et celles-ci montrent un PCQ qui pourrait fort bien terminer avec zéro! Cela étant dit, si les sondages avaient tort, le PCQ pourrait 'facilement' remporter 3-6 comtés. Je parle ici d'une sous-estimation dans la Beauce et la région de Québec.


Inclure un nouveau parti dans un modèle de projections est toujours difficile. Pour le PCQ, j'ai regardé l'ADQ en 2008, la CAQ en 2012 et le PCC en 2021. J'ai regardé les résultats dans certains comtés (vers Québec, la Beauce etc) et calculé des bonus. Par exemple, dans Beauce-Nord, j'ai que ADQ/CAQ/PCC performaient en moyenne 2.7x mieux que le résultat à l'échelle de la province. Cela signifie clairement que je fais l'hypothèse que ces partis sont une bonne comparaison pour le PCQ. Ce n'est pas parfait mais je trouvais cela logique. Et les projections sont ensuite ajustées en fonction des données régionales des sondages et des sondages par comté. Il reste que je m'attends à être moins précis pour le PCQ que pour d'autres partis.


Nous verrons bien si le PCQ fait son entrée à L'Assemblée. Il serait quand même triste qu'un parti qui pourrait terminer 2e en voix se retoruve avec zéro siège! Legault a fait un Trudeau (en fait pire) de lui-même en annulant la réforme du mode de scrutin. Il ne sera pas puni demain soir mais la démocratie Québécoise pourrait en prendre un coup.


Québec Soldiaire

Cette campagne ne semble pas avoir aussi bien fonctionné pour cette formation qu'en 2018. De manière amusante aussi, Legault avait clairement décidé de faire de ce parti son adversaire préféré! Combien même il n'y a pas tant de courses CAQ-QS. Non seulement les sondages sont moins bons, mais la tendance n'y est pas. De plus, si on regarde sur Google Trends, on voit une grosse baisse par rapport à 2018. Alors que Manon Massé dominait cet indicateur il y a 4 ans, Gabriel Nadeau-Dubois semble avoir plus de misère. C'est la même chose si vous regardez les partis (QS fait mieux dans ce cas mais la domination de QS reste moindre qu'il y a 4 ans).

Il se peut que les gens connaissent davantage QS mais mon experience avec Google Trends est que si tu es connu, tu continues de générer de l'intérêt. Si ce n'était pas le cas, Trudeau ne serait pas premier sur Google trends!


Si la firme Mainstreet a raison, QS va connaitre une très mauvaise soirée et pourrait chuter à 6-7 sièges et ne récolter que 12%. Je n'ai pas cela en moyenne et je crois que QS va conserver ses sièges sauf Rouyn et possiblement Jean-Lesage. QS devrait aussi gagner Maurice-Richard et Verdun. De manière générale cependant, Québec Solidaire va p-e vivre sa première élection sans réelle progression et je me demande s'ils vont devoir réfléchir à leur avenir. Cela étant dit, on ne peut pas exclure un scénario ou GND se retoruve chef de l'opposition officielle et serait clairement l'alternative pour 2026.


Le premier sondage Angus Reid est paru ce matin et il a la CAQ à seulement 34%. On voit vraiment une petite baisse du parti de François Legault, y compris chez Mainstreet. Mais sa domination dans le 450 et en régions, y compris l'Est du Québec ou nous avons maintenant plusieurs sondages (Léger, Synopsis) montrant la CAQ qui domine le PQ, fait en sorte que sa majorité est non seulement assurée mais confortable.

Au final nous n'avons de loin pas un consensus entre sondeurs. Certains ont la CAQ bien plus élevée (y compris les sondages par comté), QS varie de 12 à 21%, le PCQ aussi. Les sondages nationaux montrent le PLQ en chute chez les anglo mais les sondages par comté montrent ce parti solide dans ses sièges. Situation bizarre vraiment.


La carte


Aujourd'hui nous avons eu l'habituel nouveau Mainstreet, mais aussi un nouveau Léger et un nouveau Ekos. Ces sondages s'entendent pour avoir la CAQ devant mais c'est à peu près tout. Mainstreet continue d'avoir QS et le PQ vers les 10% alors qu'Ekos a QS à 21%! Léger est entre les deux à 17%. Il y a d'autres différences mais QS et PQ semblent vraiment être les deux partis qui fluctuent le plus entre maisons de sondages.


Ajoutez à ces sondages discordants les sondages par comtés qui montrent une situation parfois très surprenante (le PLQ qui gagne encore facilement dans Marquette par exemple, la CAQ en hausse de 10 points dans tout le Québec francophone, ce qui n'est pas en ligne avec la CAQ vers les 40% à l'échelle de la province) et on se retrouve avec une situation où on n'a pas une idée très claire de la situation.


Ces projections font la moyenne des sondages mais, soyons honnête ici, il se peut fort bien qu'une firme ait raison alors qu'une autre aura très tort. Faire la moyenne n'aide peut-être pas dans ce cas. Mais vu que je n'ai pas envie d'essayer de deviner qui dit vrai, je fais la moyenne. J'espère que les sondages convergeront un peu d'ici la fin de campagne!


Remarquez l'intervalle de la CAQ. Son plus bas pourrait maintenant être 75 sièges. C'est toujours une majorité comfortable mais on est loin du 100 sièges. D'un autre côté, si les sondages par comté ont raison, 100 sièges restent possibles.


La carte


 Vous savez comment ça marche, deux questions. Merci!


Poll Maker Polls
Nous avons maintenant plusieurs indications (dont ce sondage Léger) que Paul St-Pierre Plamondon a bien fait lors du Face-à-Face à TVA et qu'il a relancé son parti. Je ne parle pas ici de placer le PQ pour prendre le pouvoir mais la formation souverainiste se retrouve au moins au-dessus des 10%. Rendue à 12-13%, et avec la CAQ en légère baisse, le PQ devient compétitif dans 5-10 comtés, dont celui de son chef.

L'autre tendance que l'on observe est une chute du PLQ. Anglade est perçue partout comme ayant été la plus mauvaise lors du débat. On voit aussi une chute dramatique chez les non-franco (le PLQ n'y est qu'à 43% dans le Léger de ce matin!). Aussi, les sondages par comtés, surtout ceux faits par Segma, montrent tous un scénario cauchemard pour les Libéraux. Je parle ici de récolter à peine 10% des intentions de vote à l'échelle de la province. Si cela devait arriver, le PLQ serait vulnérable même dans l'Ouest de l'île et Québec Solidaire pourrait se retrouver comme opposition officielle.

En passant, ces sondages par comté ne s'alignent pas du tout avec les autres sondages. Ils montrent la CAQ en hausse de 12 points par exemple! On verra qui aura raison le 3 octobre, mais mes projections partent du principe que les sondages provinciaux sont plus précis. Donc gardez cela en tête.

Les projections ne bougent pas encore beaucoup mais les intervalles ont changé. On arrive à une situation où quelques points de pourcentage pourraient faire une grosse différence. Le débat des chefs sera crucial!


Il y a maintenant aussi une petite chance que QS termine devant le PLQ. On parle de 8 simulations sur 10,000, mais cela reste possible. Et à voir la tendance, je me demande si cela ne deviendra pas la vraie course de cette élection.

La CAQ reste dominante et pas à risque de perdre sa majorité. Sa domination dans le 450 et dans les régions lui assure 63 sièges. Cependant, la taille de cette majorité pourrait être moins élevée que prévue. Il faudrait toutefois que le PCQ se rapproche dans la région de Québec et en Bauce. À date, les sondages ne montrent pas cela. J'aimerais beaucoup avoir quelques sondages dans Chauveau, Beauce, Chaudières, etc. Au lieu de sonder Chicoutimi!

Voici la carte:


Finalement les projections par comté avec les probabilités.

 Petits sondages pas scientifiques. Deux questions.


Polls Poll Maker

Nous avons le premier vrai débat ce soir à TVA et, ce matin, nous avons enfin eu un nouveau eu un nouveau sondage Léger. Cela fait du bien d'avoir une autre source d'info que Mainstreet. Aussi, les chiffres de ce matin ont confirmé que la firm Mainstreet a un "house effect" contre Québec Solidaire. Mainstreet fait ses sondages par téléphone et je suspecte que ses échantillons pour les 18-34 ans sont un peu bizarres (qui répond au téléphone dans cette tranche d'age?). Pour un parti comme QS dont le vote est très concentré auprès de ce groupe démographique, cela peut potentiellement causer des problèmes. Oui Mainstreet compense avec la pondération mais si les 18-34 ans qui acceptent de répondre sont fondamentalement différents des autres 18-34 ans, les réponses seront biaisées.


Je ne dis pas que Mainstreet a tort quand ils ont QS à 10% au lieu de 17% comme Léger, je dis juste que Mainstreet a QS plus bas que toutes les autres firmes (on a eu un sondage Segma à Québec qui était plutôt en ligne avec Léger. Aussi les deux sondages par comté d'Ekos étaient compatibles avec les chiffres de Léger, pas Mainstreet).


Quoiqu'il en soit, voici les projections.


On voit que la CAQ domine complètement mais si on regarde les intervales, on voit que la CAQ est pas mal au maximum déjà. Pas beaucoup de potential en termes de gains mais une légère baisse dans les sondages (ou une surestimation) pourrait causer plusieurs pertes (elle resterait majoritaire bien sûr).


La carte


Carte au complete.


Les projections détaillées.


I thought that my quasi final projections would actually double as my actual final ones but Elections Canada released some more complete fundraising data yesterday. The number of extra donors is quite significant (Poilievre, for instance, goes from 37,729 single donors to 50,441, mostly thanks to new data going into July). Lewis also increased quite a lot thanks to the July numbers. I have also updated the Google Trends numbers.


I have therefore re-run all my stuff and here it is. You have the projections with the range, the results by provinces as well as the riding-level map. Keep in mind that the map is likely a lot less accurate than the overall numbers. The projections are based on the fundraising (mostly the number of donors but also the amounts), numbers from Google Trends as well as the one Mainstreet poll (which polled the existing members of the party). I also want to the most recent Ipsos poll (of voters, not members) showing Poilievre increasing his lead over Charest.


I have Poilievre winning a majority of points over 99% of the time. He wins 100% of the time as he has way more down ballot support than Charest.


Quite a high chance that Lewis gets more votes but fewer points than Charest. She has a 10% chance of getting more points. It'll be difficult for her as Charest's vote is very likely more efficient thanks to Quebec.


Charest has a 13% chance of winning Quebec. Yes this is low.


Results by provinces (those are percentages of points).


Finally the map. Poilievre wins 322 ridings, Charest 13 (11 in Quebec), Baber 1 (his own), Aitchison 1 (his own) and Lewis 1 (Nunavut but she could win her riding as well). Poilievre wins every province and region by more than 50%. This is really impressive. And those numbers could be higher if I didn't include the Mainstreet poll in my averages (using only the fundraising, I get Poilievre closer to 66% overall).


Petite mise à jour rapide avec le Mainstreet de ce matin. Le PQ continue de grimper et se retrouve devant QS dans ce sondage (mais ma moyenne continue d'inclure le Léger, même si ce dernier commence à se faire vieux). Le PCQ baisse et se retrouve 18 points derrière la CAQ dans la RMR de Québec.


Il y a aussi quelques signes (le sondage Ekos dans Verdun, les sondages Mainstreet) que le vote Libéral n'est pas aussi efficace que l'on ne pourrait le penser. Le PLQ semble faible sur l'île et faire mieux que prévu en banlieues. Le problème c'est qu'à part à Laval et dans 1 ou 2 autres comtés, c'est un vote inutile.


Voici les projections et la carte.


La CAQ montre quelques signes de faiblesses. Elle est encore dans la fourchette haute de son intervale mais le plancher théorique baisse (en partie car le PQ grimpe).


Projections détaillées ici.

 Répondez au sondage ci-dessous.


QuizMaker

Si vous voulez juste voir les résultats, cliquez ici.

Mise à jour importante ce matin car j'ajoute non seulement le sondage Mainstreet d'hier (un sondage qui plaçait le Parti Conservateur à près de 30% dans la grande région de Québec) mais j'ai aussi fait des modifications importantes.


Pour les impatients, voici les plus récentes projections ainsi que la carte.

Toujours aucun suspense tant la CAQ est dominante mais il y a possiblement davantage de courses intéressantes en raison de la progression du PCQ.


La carte continue d'être pleine de bleu turquoise.


La carte est toujours dispo ici.


Okay, parlons des modifications que j'ai faites. Le modèle est, somme toute, assez simple. Je prends les résultats de la dernière élection dans chaque comté, j'ajoute le 'swing' provincial et voilà. Je fais ensuite des ajustements avec les chiffres par régions (et comtés si nous avons des sondages) ainsi que si un parti connaît une grande croissance ou décroissance entre les deux élections (une 'vague'). Cela fonctionne bien sauf si certains évènements se produisent. Parmi ceux-ci, la création d'un nouveau parti peut poser des problèmes. Nous avons cette année l'arrivée d'un Parti Conservateur très différent de celui qui existait techniquement il y a 4 ans. Utiliser les résultats de 2018 ne nous donne pas vraiment une bonne idée de la répartition géographique du vote PCQ.


Jusqu'à maintenant, j'espérais que les sondages nous donneraient des chiffres par sous-régions détaillées, voire même par comté. Mais ce n'est pas le cas. Tant Léger que Mainstreet nous donnent le RMR de Montréal, le RMR de Québec et le reste de la province. Cela n'est pas suffisant pour avoir une bonne approximation du PCQ. J'ai ainsi décidé de faire des ajustements. Il est évident que le PCQ partage beaucoup avec la défunte ADQ, ainsi que le Parti Conservateur fédéral. J'ai donc regardé les résultats en 2008, 2012 (CAQ fusionnée avec ADQ) et 2021 (fédéral mais transposé sur la carte provincial). Pour un comté comme Chauveau, l'ADQ/CAQ/PCC récolte en moyenne plus du double de son score à l'échelle de la province (stable sur ces trois élections). J'ai fait ces calculs dans tous les comtés de la grande région de Québec ainsi que de la Beauce, etc et j'ajoute ainsic es ajustements au modèle.


En gros, mon modèle assume que le PCQ est un parti avec une distribution géographique très similaire à l'ADQ et au PCC. C'est une hypothèse et j'ai peut-être tort. Mais c'est mieux que rien selon moi. Aussi, j'ajuste toujours en fonction des sondages pour m'assurer que tous les partis sont proches de la moyenne des sondages dans chaque région. En d'autres mots, mes hypothèses ici ne sont pas absolues et ne vont pas à l'encontre des données des sondages.


Tout ça pour dire que le nouveau modèle a le PCQ avec un vote plus efficace. Le parti d'Éric Duhaime est en fait compétitif (chances au-dessus de 2%) dans 6-8 comtés. Cela ne prendrait pas un grand 'swing' entre la CAQ vers le PCQ pour que ce dernier se retrouve avec plus de 5 députés. Un résultat qui ferait très probablement en sorte que le paysage politique au Québec soit maintenant entre la CAQ, QS et le PCQ, 3 partis qui n'existaient pas il y a 20 ans. Un remplacement total du PLQ et PQ.


La CAQ est largement en tête mais sa coalition d'électeurs a changé en 4 ans (et encore plus en 8 ans). Regardez les 2e choix dans les sondages, les électeurs CAQuistes ont surtout le PQ et QS! On est loin du petit parti de droite comme l'ADQ. Il semblerait que le PCQ ait remplacé la CAQ à droite. Et la droite au Québec, on a une assez bonne idée d'où elle est. Regardez les projections détaillées ci-dessous pour voir dans quels comtés le PCQ est compétitif.


Le sondage Mainstreet avait le PCQ plus élevé que Léger et que ma moyenne, nous verrons s'il s'agit d'une rvaie tendance ou juste des variations typiques des sondages de cette firme. Si le PCQ devait grimper au-dessus des 20% et la CAQ baisser vers les 35%, on aurait alors entre 6 et 10 sièges en jeu entre ces deux partis.


Vous pouvez utiliser le nouveau simulateur ici.

Projections par comté ici.

Après le Léger de samedi, voici le premier Mainstreet. Cette firme devrait publier un sondage quotidien, fait par téléphone (Léger est en ligne).


Mainstreet est une firme qui a souvent les partis de droite (PCC au fédéral par exemple) plus élevés. Elle a aussi les jeunes qui sont davantage à droite de manière quasi systématique. C'est vraiment une conséquence de leur méthodologie. En général leurs sondages ne sont pas mauvais mais gardons cela en tête. Léger avait le PCQ à seulement 14% par exemple.


Si j'ajoute ce sondage à ma moyenne, cela ne change pas grand chose. La CAQ est tellement dominante quasiment partout que changer quelques points de pourcentage n'a pas une grande influence. Regardez par exemple les intervales de confiance à 95%, la CAQ est entre 84 et 97. Ce n'est pas particulièrement large pour un parti en tête. Cela nous montre simplement que la CAQ n'est pas en danger mais, en même temps, n'a plus beaucoup de sièges qu'elle pourrait remporter. En gros, soit elle gagne facilement soit elle perd de beaucoup, si on simplifie.


La carte des projections

Page au complète.


Projections par circonscription


Soyons honnêtes, l'histoire de cette élection pourrait fort bien être la percée du Parti Conservateur d'Éric Duhaime. La CAQ étant maintenant bien pl;us centriste qu'en 2014, il y a une ouverture à droite. La fatigue de la pandémie aide aussi (mesures Covid, etc). Le PCQ n'est pas actuellement projeté gagnant dans aucun comté (et cela magré un bonus au chef Duhaime dans Chauveau) mais le parti est compétitif dans 4-6 comtés. Les nouveaux partis ont en général besoin d'un petit coup du pouce via un candidat local fort pour remporter des sièges (pensez QS). Est-ce le PCQ a de tels candidats? À part Duhaime, on verra. Il nous faudra surement des sondages par circonscription pour vraiment mesurer.


Bon voilà, demain je publierai une petite analyse/scénario où je montrerai à quel point il serait difficile pour la CAQ de ne pas gagner une majorité.