Alright, for the dozen of people who care, here's my final projections for the 2023 Ontario Liberals' leadership race. The voting is happening this weekend and results will be unveiled on December 2nd.
As usual with leadership races, I make the assumption that fundraising data is the best data available. This has worked remarkably well on a few occasions. I pretty much nailed the CPC 2022 race, while I was alright but less close in 2020 (had O'Toole winning on my last update on Twitter) or 2017 (I had Bernier ultimately winning; Note: both 'errors' mostly were caused by Quebec with its really low number of members). I was also very successful in two PQ races in Quebec, in 2020 but particular in 2016 where polls all had Cloutier as favorite.
Leadership races are weird. We usually don't get good polls (except maybe for the CPC races where Mainstreet manages to get the membership list), rules are weird (points per riding, etc) and turnout is often low. So while I really like covering such races, keep in mind that projections are less accurate than for regular elections.
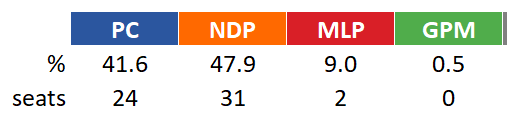
Alright, with this behind us, here are my projections for the OLP race.
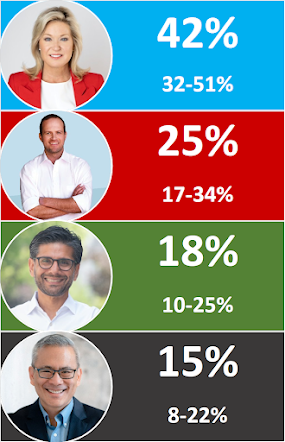
Yes the intervals are large. I looked at my accuracy over 5 leadership races and it told me that while I was 4-5% off in average, the correct margins of error to represent the full uncertainty were around 10% (for a candidate at 50%, less for candidates that are lower). It's not an attempt by me to cover my ass, it simply represents the fact that leadership races are hard to call.
Bonnie Crombie is the favorite but the uncertainty is such that all four candidates have a path. Some paths are just narrower than others. In order of certainty, I'd say this:
1) Crombie will be first after the first round
2) Nate Erskine-Smith will finish 2nd after the first round and face Crombie in the final round
3) Crombie will win
I wouldn't put a lot of money down on my third call though.
The data
I have used is a mix of the fundraising from Elections Ontario as well as data from Google Trends. The last one might seem stupid but it has proven to work remarkably well in previous races. For the fundraising data, I did an average of the (unique) number of donors (both over the entire race as well as since September 1st) and the amounts collected. I give a much bigger weight to the number of donors as one vote is one vote, no matter if the person donated $200 or $1000. With that being said, higher amounts usually indicate support among older voters and their turnout is stronger, so I wanted to use this part of the data. If you want to know the details, I gave the number of donors a weight of 50% while the number of donors since September got 25% (the candidates could only sign new members until September 5th, thus the Sept. cutoff in my calculations; It's simply a way to measure the late momentum) and the total amounts collected got the last 25%. As for how I mixed Google Trends, I did a 75-25 average (75 on the fundraising). The weights are mostly 'vibes'. I don't believe the exact weights matter, I just want to mix all the data available. Again, leadership races are just harder to predict and my experience has been that mixing works best.
Important details: we only get the data for donations over $200. I suspect that Nate Erskine-Smith has more donations under $200 than Crombie as he's targeting young voters.
Google Trends is interesting as Bonnie Crombie has been crushing it there from the start and Nate has been surprisingly bad on this metric. Yes Google Trends is mostly a popularity contest but so are leadership races.
Crombie's lead, depending on the metric, goes from 30 points (Google Trends) to being tied (number of unique donors since September; She is actually 3 donors behind Nate! He definitely had the momentum at the end). She also has the lead when it comes to new members signed, although not all campaigns reported numbers (Crombie said 38,700, Naqvi said 31k and Shamji, before dropping and endorsing Crombie, said 12,063. I don't believe Hsu and Erskine have revealed numbers. The party has said there were 103k members total, so assuming Crombie, Naqvi and Shamji told the truth, Erskine and Hsu add up to 21k. This seems low for Erskine but there is likely a reason why he said he "wouldn't play the number game" and didn't reveal his numbers. You don't do that when your numbers are good. Just ask Jean Charest!
Finally, Crombie has been leading in the polls by huge margins, but it's among OLP voters, not members.
Second choices
Out of the 2516 donations, 207 were from people who donated more than once (including 93 people who donated to more than one campaign). Using donations by the same person to multiple campaigns, I got the following pairing table. It's based on so few observations that I don't feel confident using it to make projections past the first round.
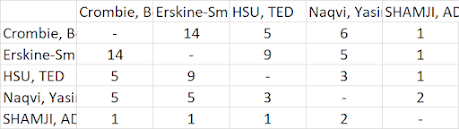
I'll say one thing: I think the narrative online that Crombie has no down ballot support among the other three candidates is not consistent with the data. I wouldn't be surprised if this were a Twitter-isn't-real-life thing. I'm also very curious as to how effective the deal between Erskine and Naqvi will be. We remember how Kennedy delivered his delegates to Dion in 2007 but that was during a convention, very different. In a related manner, how much of the Shamji endorsement will be useful to Crombie? Hard to say.
The huge uncertainty (complete lack of info really) regarding second choices is really what is preventing me from making a more official call. I believe Crombie will be ahead after the first round (even though I'm not sure if it'll be by a lot or a little), I believe Nate will face her in the final round but I can't really tell how Hsu and Naqvi supporters will vote once their preferred candidate is eliminated. My intuition tells me that Crombie better have a strong lead after the first if she doesn't want to become the next Bernier or MacKay, but I suspect the lead required is less important than some on Twitter would like you to believe.