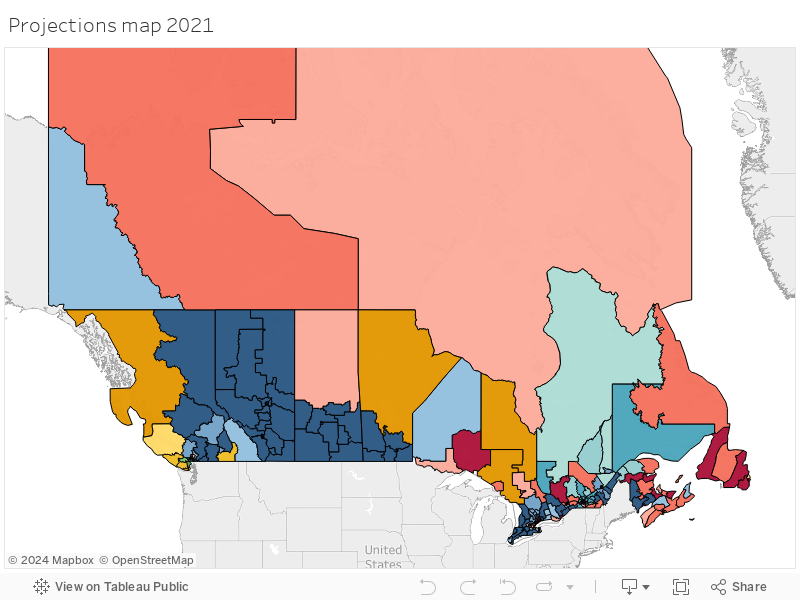
The first few polls of this campaign have been less positive for the Liberals than the ones in recent weeks. Trudeau is still hugely favorite to win the most seats but a majority is now less certain. At 59%, the odds are still in Trudeau's favour but it's significantly less than the 75+ we had just before the start of this campaign.


The Conservatives are doing much better in BC but are still trailing in Ontario. They are back above 100 seats but their chances of even a simple plurality are low (although increasing).


The two good news for the Liberals are Quebec where most polls still give them a big lead over the Bloc (note: except Leger) and what appears to be substantial gains among the 55+, a demographic that votes more than others.


Anyway, here are the latest projections:

Below the seat projections are the 95% confidence intervals


Detailed projections

Proj Canada 17 August 2021 by bryanbreguet on Scribd


Map


Full page interactive version. Hold 'shift' to move the map around with your mouse cursor.


Alright, it's finally officially on. Early federal election starting today with e-day on September 20th.
Let's take a look at where we stand right now. If you want quicker updates, follow me on Twitter.

Projections

Voting intentions, seat projections with 95% confidence intervals, probabilities


Map


Full screen interactive version. Performance isn't the best (it depends), so give the map 1-2 seconds if you zoom in or out.

Short analysis

Trudeau has enjoyed a polling bump ever since Covid started, even though the gap has now been cut in half compared to what it was in April 2020. Still, given that the Liberals weren't that far from a majority in 2019 (with 33% of the vote, thanks FPTP!), it is natural that any bump would bring them closer or above the 169 seats threshold.


One caveat is that the Liberals won 157 seats in 2019 thanks, partially, to an incredible vote efficiency (i.e: winning close races; concentrating their support in the ridings they can win). That creates a somewhat weird situation where the Liberals could be up by a few percentage points and that wouldn't necessary translate into many additional seats. This is why the Liberals really need big leads over the Bloc (in Quebec) and the CPC (in Ontario) if they want a majority. As I showed a few days ago, the Liberals are comfortably in majority territory as long as they keep both leads to 10 points. But should one lead shrinks to 'only' 5 points and the odds of a majority are at 50-50 at best.

This is why I currently have the chances of a majority at 70%. It is there, no doubt about it, but the gamble that Trudeau took this morning might be more risky than it appears. The lead over the Bloc, in particular, doesn't feel as solid as the lead over the CPC in Ontario. I personally would expect Yves-François Blanchet to run another great campaign and bring his party to at least 30%. The most recent Leger poll showed that while people (including Québécois) are usually okay with Trudeau and his government, few would want a majority. This is something the Bloc can easily use to its advantage.

While Ontario is usually the center of attention for any federal election, it might be different this time around. This seems to be the most stable province compared to 2019 and Trudeau is polling actually lower than two years ago. It might be because the 'Ford effect' is now mostly gone, thus compensating the Covid bump? Don't get me wrong, the Tories are not doing better there, it's just that the gap with the Liberals is essentially the same.

Speaking of which, the Conservatives start this election with almost no chances of finishing first (not even a plurality). The party is bleeding on its right (many polls have shown that the CPC has lost more voters to the PPC/Maverick than to the Liberals) all while not making any gains in the center. O'Toole has clearly tried to re-center his party and enlarge his coalition, but it hasn't worked yet. So the CPC has this worst case scenario where the base is unhappy and the moderates aren't joining. The bleeding on the right might end up not costing too many seats (the CPC will just win the rural ridings in Saskatchewan and Alberta with smaller majorities) but it creates a situation where O'Toole has to fight on both fronts. Given the polling numbers, I wouldn't be surprised if the Tories decide to run a boring, catered-for-the-base campaign with the aim of saving the furniture (i.e: winning 100 seats) all while hoping the NDP and Bloc are preventing a majority. This plan might work as long as they don't drop too much in the West, in particular in BC where some polls are straight up disastrous for the CPC.

The NDP is the other party starting this election in good shape. Very different compared to the  beginning of the 2019 campaign where the NDP was polling at the same level as the Green party, around 10-12%. Singh ultimately won that battle (partially by winning the English debate) and enjoyed good momentum at the end of the campaign. It didn't translate into as many seats as they had hope but it created a strong foundation to built onto. Singh also benefits from being, by far, the most liked leader federally. If he plays his cards well, we could see a mini orange wave with the NDP gaining many seats in Ontario and BC. This could be helped by the fact the CPC isn't a 'threat' as far as forming the government is concerned, thus negating any call for 'strategic voting' the Liberals will throw around.

The Green party is collapsing in front of our eyes with a party actively sabotaging the efforts of its new elected leader. This is spectacular to witness but sad democratically. They already lost one MP (Fredericton) who decided she wanted to keep her seat and run for the Liberals (shameful but whatever) and they could well end up with only one elected MP, Elizabeth May, the former leader. I can't see this party getting its shit together during the next 4 weeks and I think the only real question is who benefits from the collapse, the Liberals or the NDP? Polls don't necessarily agree on that front.

Finally, the Bloc is polling significantly lower than in 2019 but things could change quickly. Blanchet is still liked and the Bloc as well. If the election becomes a question about giving Trudeau a majority, the Bloc would be ideally positioned. Blanchet also has the benefit of being able to campaign in Quebec every day while Trudeau will need to spend a lot of time elsewhere. My guess is the Bloc has the objective to regain some or the urban ridings it should have won in 2019 (Hochelaga, ridings on the south shore of Montreal). The Bloc could be under threat of the Conservatives if they were to increase in Quebec (both parties do share part of the electorate) but O'Toole's French is too weak in my opinion for him to make major inroads in La Belle Province. Also, as mentioned previously, the CPC will likely play defense for most of the election. That means spending more time in Ontario and BC than in Quebec.

Alright, that's all for now. Happy election!


Detailed projections

Proj Canada 15 August 2021 by bryanbreguet on Scribd

I have included the polls from Angus-Reid, Abacus and Innovative.


The Liberals are clearly in majority territory and there is almost zero uncertainty regarding who would finish 1st and second. Find the detailed projections below the map.

Map:


If you want an interactive version.


Projections:

Proj Canada 13 August 2021 by bryanbreguet on Scribd


Possible outcomes:


Qui dit élections fédérales, dit rôle important pour le Québec. Non seulement la province a un nombre important de sièges (78 sur 38), mais son électorat a prouvé qu'il était volatile. Le Québec est d'autant plus important cette année car il se pourrait fort bien qu'une majorité pour Trudeau passe impérativement par le Québec.


Partons des plus récentes projections ci-dessous:


Et la grande région de Montréal en particulier:


Si vous voulez les projections détaillées:

Projections Canada 2021 10-08-2021 by bryanbreguet on Scribd


Il y a aussi la carte intéractive ici.


Les Libéraux de Trudeau sont actuellement projetés en terrain majoritaire. Les chances que le PLC remportent au moins 170 sièges sont de 70%. Cela semble assez comfortable, non? Pas vraiment. Tel que je l'ai démontré il y a quelques jours, le PLC se doit de conserver deux avances: son avance sur le Bloc au Québec (environ 10 points actuellement) et son avance sur le PCC en Ontario (là aussi environ 10 points). Si le PCC devait grimper en Ontario ou le Bloc au Québec, atteindre le chiffre magique de 170 deviendrait bien plus compliqué.


Le Bloc est en baisse dans les sondages par rapport à son résultat en 2019. Pas de beaucoup (environ 4-5 points) mais, couplé à la progression des Libéraux (en hausse justement de 4-5 points), cela génère des gains importants pour le PLC. Des comtés comme Abitibi--Baie-Jaimes, Rivière-des-Milles-Îles, Thérèse-de-Blainville ou encore Montarville. Le PLC se retrouve à 44 sièges (progression de 9) et le Bloc à 22 (perte de 10). Petite remarque, le modèle part du principe que Ruth Ellen Brosseau se représentera dans Berthier-Maskinongé pour le NPD. Mais cela semble peu probable et je devrai ajuster ce comté manuellement. Ce siège devrait ainsi revenir au Bloc.


Les sondages ne semblent pas s'entendre sur le score du Bloc. Alors que Nanos a toujours ce parti très bas (25% et moins), d'autres l'ont bien au-dessus des 30%. Aussi, il semble assez probable que le Bloc et Blanchet ne puissent pas rivaliser avec la couverture médiatique que reçoit Trudeau hors campagne électorale (merci Covid!). Mais cela devrait changer une fois en élection. Donc partons du principe que les intentions de vote pourraient rapidement se retrouver proches des résultats de 2019. Si l'on regarde ces derniers, on remarque que bien que le Bloc ait connu une bonne élection, reprenant beaucoup de sièges du NPD, il s'est buté sur un PLC efficace sur l'île (Hochelaga) et sur la Rive-Sud (Chateauguay par exemple). Le Bloc a perdu plusieurs luttes serrées, probablement car le PLC avait une meilleure organisation.


De manière plus générale, le Bloc est un peu un parti de gauche (son programme, ses députés) mais avec un électorat de droite (plus masculin, plus agé et avec moins de diplômés universitaires). Sur bien des enjeux, on voit que les électorats Bloc et PCC se rejoignent (ne pas aimer Trudeau par exemple ou si l'on regarde les 2e choix). Je ne dis pas que les électeurs Bloquistes sont tous de droite, je dis juste que ce parti a un électorat qui est plus à droite (et davantage susceptible de voter PCC) que les électorats du PLC ou NPD. Le seul point où les électeurs du Bloc semblent en désaccord complet concerne les changements climatiques. On n'a plus un Bloc qui dominait tout l'est de l'île et qui gagnait même dans Ahuntsic. Non, le Québec a vécu plusieurs ajustements entre 2008 et maintenant et le Bloc actuel n'est pas le Bloc de Duceppes en 2008.


Le défi principal de Blanchet lors de la prochaine élection sera d'essayer de regagner ces électeurs plus à gauche dans les centres urbains et en banlieues. Sur l'île de Montréal, le Bloc devra aussi compter sur un NPD qui ressemble de plus en plus à un Québec Solidaire fédéral. Des comtés comme Hochelaga ou Sherbrooke pourraient bien se retrouver sour le NPD. Mais les comtés en banlieues devraient rester une lutte Bloc vs PLC. Le Bloc devra aussi se méfier d'une possible poussée des Conservateurs avec leur nouveau chef, mais il est trop tôt pour parler des chances que cela arrive. Cela étant dit, une montée du PCC se ferait probablement au détriment du Bloc en régions et pourrait causer des courses à 3 qui favoriseraient le PLC.


Au final, si Blanchet pouvait conserver ses 32 sièges, cela mettrait le PLC aux environs des 170 sièges au total, soit juste au-dessus d'une majorité. Cette dernière reposerait ainsi sur des gains en Alberta (Calgary, Edmonton) et en CB. Une majorité resterait possible mais bien moins probable. De plus, si le Bloc devait réussir à regagner les comtés sur la Rive-Sud (en partie grâce à une meilleure organisation qu'en 2019), alors le Bloc pourrait bien faire des gains et ruiner les chances d'une majorité pour Trudeau.

My latest projections (done before the latest Abacus and Angus-Reid polls but adding them doesn't change much) showed Trudeau and the Liberals in majority territory, I also mentioned that this majority was far from guaranteed. Many things would need to go right (or stay right) for the LPC to get over 169 seats. The chances were about 66%, not bad but an early summer eleciton 9during a potential 4th wave) does have some risks for Trudeau.


I then wondered which variable was the most important. Is it the lead the Liberals have over the Bloc in Quebec? Or maybe it's the lead they have over the CPC in Ontario. Or maybe the key is actually in Alberta and BC. The beauty of running simulations is that I can then use the data to answer such questions. So I used the results of the simulations (specifically the number of seats won by the Liberals) and looked at the correlations with multiple variables. I used a Logit regression to do so. Here below is the result.


If you don't know what a regression is (even less a logit regression), just know that it measures correlations while holding the other variables constant. So we get marginal effects. A logit is just a specific form of regression used when the dependent variable (the one we are trying to explain) is binary (1 for a majority, 0 otherwise). Using the results, we can estimate marginal probabilities (what happens to the chances of a majority if the Bloc gains 2 points over the Liberals in Quebec?) as well as doing some nice little graphs.


For the logit regression, I included the following variables: the gap (in voting intentions in %) between the LPC and Bloc in Quebec, the gaps between the LPC and CPC (as well as LPC and NDP) in Ontario, Alberta and BC. I didn't include the country-wide numbers as they were irrelevant (I tried at first), which makes sense.


So, what is the single most important factor? In magnitude, it's the LPC-CPC gap in Ontario, followed closely by the lead of the Liberals over the Bloc. The two are very similar and the LPC-Bloc gap is actually more significantly statistically. I'm not saying that the lead of the Liberals over the NDP in BC isn't important, just not as much.


It makes sense really and you can simply use the model to run some simple simulations (you can try with the simulator yourself although the current numbers in it aren't the most up to date, but you can change them). Using my model with the most updated numbers, I get that a swing of 10 points (-5 and +5) from the LPC to the Bloc would cause the Liberals to lose 11 seats. A same swing between Liberals and Conservatives in Ontario would cost Trudeau 17 seats.


Both simulations show that the Liberals need to keep those two leads if they want to win a majority. If they were to lose either of them (note: at this point, their lead in Ontario is a lot more solid than their lead over the Bloc as Quebec is always unpredictable), their chances of a majority would essentially become 50-50 at best.


Graphically, let's represent the probabilities of a Liberal majority as a function of the lead of the Liberals over the Bloc in Quebec and over the CPC in Ontario:


The current leads are, respectively, about 10-11 points over the Bloc and about 9-10 points over the Tories in Ontario. Both would indicate about a 60-70% chances of a majority, which matches (obviously) my latest projections. But what this graph shows is that the chances are more sensitive to a drop of this lead in Ontario (steeper slope). All those seats in the 905 would come back into play if O'Toole could gain a little bit over the Liberals compared to 2019. Side note, but this is why I don't think the Tories really have no chance of winning a plurality or that they were soooo far from it in 2019. The fact is that you can easily have 10-20 seats flipping in Ontario and doing so would bring the Liberals not only below 170, but much closer to the Conservatives.

Alright, let's do this again. And by this, I mean making projections for a federal election. I haven't been particularly successful for federal elections (compared to provincial ones) but I decided I had time to cover the upcoming federal election. If you have any questions, just follow and ask me on Twitter.


My model in 2019 performed okay (making 38 mistakes using the actual percentages of votes from the election) but was underestimating the Liberals. This was mostly due to an incredible vote efficiency from the party of the Prime Minister. Not only did they win most of the close races they were involved in (something like 15 out of 20 but don't quote me on this), they also reinforced their urban vote, which allowed them to continue winning not only the entire city of Toronto, but seats like Halifax or many in urban centers in the West.


Since then, I have updated the model with demographics (age, gender, income and education) in the hope of capturing any shift of the electorate (beyond the top race numbers).


Anyway, here are the first projections of this (currently non-official) 2021 election.

LPC: 181 seats

CPC: 103

NDP: 30

Bloc: 22

Green: 2


You can see an interactive version of the map here. Performance is okay (and it varies with your computer and internet connection) but isn't the best, so allow 1-2 seconds after zooming in or out. Sorry but this is the best mapping software I found and that I can use easily.


The Liberals have been polling well over the last year, fully benefitting from a Covid bump like many other incumbents. However, the current lead is significantly less than it was in spring of 2020. It's still enough to currently be projected with a majority but the number of seats (181) might be giving a false sense of how safe this majority is. The seat total for the LPC is only that high because the Bloc is polling, in average, at only 28%. But this party has been polling all over the map, from being as low as 22% to as high as 37%. The Bloc is also a party that would likely benefit from a campaign (more exposure). I'm not saying the polls are wrong, I'm saying Quebec is unpredictable and I'm not sure the Liberals are really ahead there by over 10 points.


This is important because if that's not the case, then the Liberals are barely above the 169 needed for a majority. Yes they'd make gains in Atlantic, the Prairies and especially BC (really good polling numbers!), but they'd also also lose some urban seats to the rising NDP (Davenport in Toronrot, etc). Without Quebec, the Liberals are right on the edge of a majority.


Maybe the most important element is that the Conservatives don't really have a shot at forming the next government, at least not right now. I have their chances at 2% of winning a plurality (which might not be good enough for Erin O'Toole to become PM) and their chances of a majority at a solid 0%. Campaigns matter but right now, even with a massive polling error, there is no path to 170 for the Tories. This is incredibly important as it creates a completely different dynamic from 2015 or 2019. Trudeau cannot, in particular, scare progressive voters into switching from the Green or NDP to the Liberals to prevent a CPC government. Coupled with the popularity of Singh (by far the most liked leader in the country) and the rising NDP numbers and we might have all the ingredients for a mini orange wave. I'm not talking of the NDP reaching 35% and forming the government (not yet?) but the NDP having the clear momentum for the first half of the campaign and eating both the Liberals (in Ontario) and the Tories (BC).


Anyway, I don't intent on doing an overly long analysis right now. So please find the detailed projections here and see you next time.


Projections Canada 2021 5-08-2021 by bryanbreguet on Scribd

I just uploaded the version 2.0 of the 2021 simulator. The big change is the addition of demographic variables. I have also made some modifications for situations such as Sloan running as an independent or JWR not running again. But those are details really.


Why adding demographic variables?

Some of you might actually be surprised that the previous model wasn't using any demographic variables. That's understandable. But you need to realize that adding such variables isn't trivial. Yes it makes sense on paper to want to be able to calibrate the model based on the gender gap or the evolution of the voting intentions of the 18-34 years old, but it's quite a lot more complicated in practice. And most models out there don't use any (308/CBC) or don't disclose much of what they do (338/Lean Tossup).


The main challenge is that we don't have results by demographics, only by ridings. We don't actually know how women voted in 2019, or how the 18-34 voted. Yes we have polls but polls are not perfectly accurate. Also, most polls only include gender and age and nothing else. Very few pollsters include information about education or income. Literally none will include breakdown by home ownership even though it is an important predictor of the vote.


Given that my model (like every single one out there I believe) used the past election results as the base and apply the swing observed in the polls since then, we really need to find a way to get the results broken down by demographics. Thankfully, the Canadian Election study (CES) can help us there. This massive survey actually has a post-election component when they ask people how they voted. It's still not perfect as people can still lie or misremember, but it's an improvement. More importantly, I can get the results by income, education or any other variable I want. I ultimately limited myself to age, gender, education and income as we get this info in some polls. It's useless for me to add variables that are never included in any polls, it won't be useful for projections.


Because even such a survey isn't 100% accurate, I decided to set up my demographic adjustments as differentials. I'm not using the actual levels for (say) the Liberals among (say) men and women, I'm using the differential. For 2019, Canada-wide, the Liberals got 34% of the vote but were at 35% among women and 33% among men, so differentials of +1 and -1. Doing so allows me to use polls and the CES even though they aren't 100% accurate (in the post-election CES, the Liberals were overestimated). Surprisingly, I discovered that polls were pretty good at estimating such differentials. I guess that while polls can make mistakes (over or underestimating a party, probably due to turnout), they are better at estimating the relative levels. That is a very important piece of good news as it means polls can be reliable to use such variables for predictions.


I also use the data from the census where we get detailed breakdowns for each demographics (for instance what percentage of voters in Rosemont are aged 18-34). Notice, however, that the census doesn't give us joint distributions, only marginals ones. It's a potentially serious limitation but there isn't much that I can do about it.


How is it done?

A very quick summary would be:

1) The province-wide percentages that you enter will determine how many votes a party will get

If you believe the Liberals are up in one province by (say) 4 points, then input them at 46% in Ontario.

2) The demographic adjustments will influence who and where those voters are.

If you believe this swing is mostly concentrated among women and educated voters, then increase their differentials.


I decided to take a two-steps approach. The first step is the same as it has always been: we use polls (or we guess) the province-wide percentages for each party. Let's say, for instance, that the Liberals are up 5 points in Ontario since 2019. Once we input this, it has to be that the average swing adds up to 5 points. It doesn't matter if the swing is coming from the Liberals doing better among women or among older people, it has to be 5 points. That's what we told the model to do!


The demographic variables are only used to allocate those 5 points across ridings. If you believe the Liberals are up by 5 mostly thanks to an increase among women voters, then the model will need to increase the Liberals more in ridings with more women. That makes sense right?


The model first applies the province-wide swings (currently uniformly but regional adjustments could come later). It then apply the demographic adjustments, one by one (since I don't have the joint distribution). If the adjustments don't sum to zero, the model takes the necessary steps to insure the final, net average swing is consistent with the provincial one. See the following example to understand the last part.


Let's imagine that you believe that the Liberals are up 4 points among women. That's the only change. In every other demographics, they are stable compared to 2019. If you only enter '+4' in the simulator for LPC-women, the model will increase the Liberals by "share of voters that are women * 4 points" in every riding. In average this is obviously 2 points (ridings don't vary that much in term of the men to women ratio and the average share is obviously almost 50%; Let's assume it's 50% for the sake of illustration). But, and this is important, if you didn't increase the Liberals by 2 points province wide (i.e: overall, they are still at 42%), then the model will apply a uniform swing of minus 2 everywhere. That is logical. The model ahs to do this to keep the province-wide swing consistent with the province-wide numbers you entered. So, overall the Liberals remain at 42% but their vote is now skewing towards women, meaning the riding numbers have changed (some have increased, some have decreased).


What you need to do if you really believe the one change is Liberals +4 among women and everything else is the same is to enter Liberals at +2 province-wide (so Liberals at 44% in Ontario) and +4 among women. This will work and achieve your objectives. [Note: before some smartass on Reddit notices the error and declares me as illiterate with numbers, yes the true correct way would be the following: increase the Liberals by 2 points in the province, then put LPC-women at +2 and LPC-Men at -2. This is consistent with the Liberals being at 42% among men, 46% among women, thus 44 overall. But it's getting complicated and, for all intents and purposes, simply putting women at +4 will do the exact same job.]


The most important numbers remain the province-wide percentages, not the demographic ones. I spent a lot of time thinking about it and it is the best solution in my opinion. Why? Well because the key numbers you need to get right in order to be accurate with your seat projections are the province-wide percentages. In 2019, if you knew that the Liberals would be at 42% in Ontario and the NDP only at 17% (so a much bigger gap than what the polls showed), I can guarantee you that any model would have given you mostly the right results. You wouldn't have needed to look at whether the Liberals were doing better or worse among the 18-34 or if they increased their lead among the university educated. No, get the province-wide percentages right and you are 95% there. This is just a fact. You can spin your model as being super sophisticated and what not but the sad truth is: whoever guesses the province-wide percentages best will have the best seat projections. Yes your model would have been even more accurate if you took into account that the Liberals were gaining more among the 55+ and the university educated, but the improvements are very marginal compared to having the correct province-wide percentages. Not even close.


Keeping that in mind, I wanted to keep having my model mostly be dependent on those province-wide percentages. The demographic variables provide adjustments but nothing else. When you are using the simulator, I'd suggest that you first enter the percentages by provinces (based on polls or what you believe will happen). Then you scroll down and you make adjustments based on demographics (i.e: you think one party is doing better or worse among some demo). Or just play with the demographic adjustments and see if you can make a party's vote more or less efficient (if you are a Conservative looking to make gains in the GTA, I suspect that improving your score with university educated might help).


What if I don't do the math right?

What happens if you enter the Liberals at 38% (drop of 4 points province-wide) but your only change in the demographic adjustments is LPC-women at +4? Well, this is clearly inconsistent but I also don't expect you to do a ton of math before using the simulator. That kind of defeats the purpose. If the LPC is up by 4 among women, this party should be up by 2 province-wide, not down by 4. That's an inconsistency gap of 6 points (+2 vs -4).


The model will first apply -4 in every riding. Then it'll apply +4 * share of women in every riding, resulting in a net average adjustment of +2. The model will thus apply another uniform swing of -2 everywhere. At the end, the objective is 1) to have the Liberals down by 4 overall and 2) to have the LPC electorate now skewing more towards women. As long as both objectives are reached, I'm happy. All of this done in a simulator that can be used without a ph.d in stats.


What does it mean? It means you don't have to do math before using the simulator. The model allows you to be inconsistent and will take care of it. Just remember that the actual, final provincial swing (and therefore average net swing) is given by the province-wide numbers you enter. As it should be.


At the end of the day, enter the province-wide numbers and then play with the demographic adjustments to see if gaining among the 18-34 would (for instance) make the NDP vote more or less efficient. And don't worry if your demographic adjustments don't sum to zero or don't average out to the provincial swing, it's all fine. If you enter numbers based on a polling average, those inconsistency should not be present anyway (in theory). Either way, the model will take care of this.


What if I leave all the adjustments at zero?

In this case, the model is assuming the composition of the electorate for each party won't have changed since 2019. The CPC, for instance, was at 33% in Ontario but at 37% among men and 29% among women (so +4 and -4 differentials). If you enter the CPC at 35% province-wide and don't change anything else, then the CPC is still at +4 among men, so 39%. The demographic adjustments are really just that, adjustments. And they are relative. In this case, the model increases the CPC by 4 points everywhere with no special adjustment for ridings with more women for instance. remember, first step decides how many votes a party receives, the demographic adjustments will change who those voters are. And everything is done with 2019 as the base. So if you leave the adjustments at zero, you are assuming the CPC voters will continue to skew older, more male with fewer university degree (but higher income!) while the NDP vote will keep skewing young and female. Leaving the numbers at zero doesn't mean you believe there is no gender (or education, etc) gap, just that the gap for this party is the same as it was in 2019.


What else?

The model currently uses a simple uniform swing model. I'll likely add regional effects soon but I was more focused on the demographic variables. Adding regional coefficients doesn't make a big difference anyway.


I'll also refine the demographic estimates from 2019 over the next few weeks. I'd like, in particular, to have different ones for Quebec and the ROC. But polls rarely provide such breakdowns.