Note: I updated this post and map on August 6th. The preliminary version only included data from Q2, I have now added the fundraising from Q1 as well. As usual, if you want more frequent updates, you should follow me on Twitter.
The fundraising is by far the best metric when it comes to projecting leadership races. It beats the hell out of polling of voters (because members and voters of a party aren't the same). Usually, however, I used the data at the province level. But this year I decided to improve on it. Since the data about the donations from Elections Canada include the postal codes, I can map them at the riding level!
This is exactly what I did here. I also made sure not to count a unique donor more than once. Some people donate more than once and to more than one candidate. Still, they'll only have one vote. If someone donated to more than one candidate, I split their vote. For instance, someone who donated to both Poilievre and Lewis (the most common occurrence of double donations), I gave 0.5 vote to each in that riding. This is why the map shows some vote totals with decimals.
If you want the full screen version, click here. Remember that Tableau maps can be slow, so zoom in and wait 1-2 seconds. The name says Q2 but it does include Q1, I just couldn't rename the project.
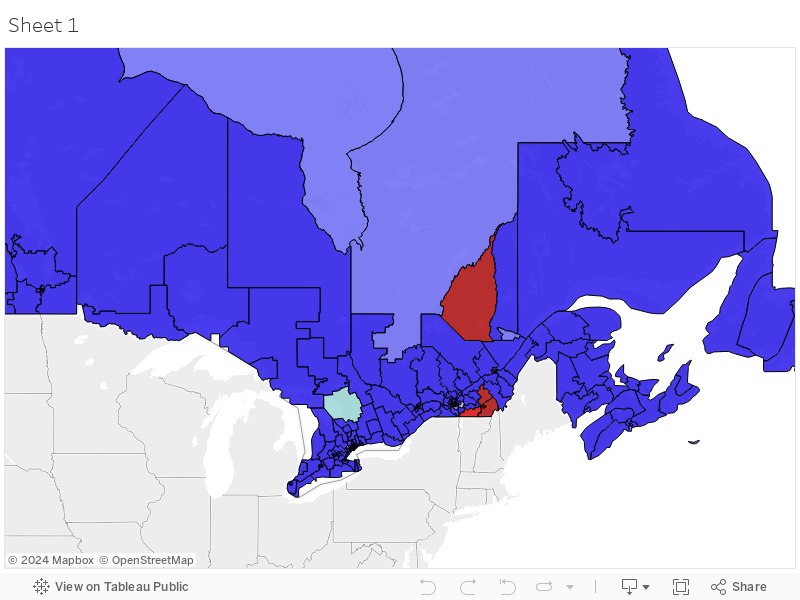
So what are the results? Well Poilievre wins easily. He gets 70% of the votes (Canada wide) and 67% of the points. He also wins 320 ridings (note: technically there were two ties with Charest, in Beloeil-Chambly and Mount-Royal Given the regions, I gave the latter to Charest and the former to Poilievre.
Charest wins 14 ridings, 12 of which are in Quebec. The only CPC-held riding he wins is Richmond-Arthabaska, most likely thanks to Alain Reyes. Charest's vote is indeed efficient (as he likes to repeat it everywhere) as he goes 8% of the votes to 12% of the points. It's nice but ultimately in line with what I had been saying: the differences between the percentage of votes and points hasn't been that big during these leadership races. The biggest gap was 4 points for Lewis in 2020. So Charest is doing the same here. Nowhere near enough to win this thing. The fact he also only wins two ridings in the GTA (hilariously, University-Rosedale and Toronto St. Paul) really should put to bed the idea he's the candidate who can win this region. MacKay ran a bad campaign but he at least dominated in the GTA!
Look, I think Charest is a good guy, a principled conservative who would be a decent leader and PM. But his time has passed. His leadership campaign has alternated from the ugly (the first 2 weeks) to the good (his policies, performances during the debates). I suspect the issue might be his team who is really not advising well (most likely because they are a bunch of Boomers who don't understand the modern CPC). Ultimately, he's not even winning Quebec.
Lewis is the only one not winning a riding. People have been wondering how the candidate who almost won in 2020 (she won the popular vote!) could fall so much. I believe there is a fairly simple explanation. First of all, the SoCons members represented 15-20% of the membership when there were about 275k members. But now that there are 675k, her share has decreased. Also, many of her 2020 voters were libertarians, anti-system, etc. They all left for Poilievre or Baber. Still, she could well end up with more votes than Charest and finishing second in points isn't impossible (she has 10% of the votes and 9% of the points).
I included Brown since he was disqualified after Q2. His numbers don't look good. 2.5% of the voters, 3% of the points. His strategy clearly failed. He pretends to have signed up 150k members but I don't believe that. His numbers have been terrible in all metrics, from polls to Google Trends. Some will argue his strategy is different (basically signing up enough new members, mostly from religious and ethic minorities to overtake the other members). Sure. But if he were successful, we should still see some signs. When he won the Ontario PC leadership in 2015, he actually dominated on Google Trends and in the fundraising. But hey, he's winning two ridings in Brampton, the city he's the mayor of. I'm just glad his numbers are so low because I don't have to sweat about how to re-allocate them now that he's disqualified.
Baber might be the surprise of this race. a guy that was mostly unknown outside of Ontario 6 months ago is getting over 7% of the votes and points. He's actually ahead of Charest in Ontario (by a lot!) and BC. He's also winning his former riding. His message is often quite close to Poilievre's, so I do believe it's relatively impressive how he managed to be so high while fighting the Poilievre juggernaut. I wonder if he's jump into federal politics after this.
Finally, Scott Aitchison has been running a nice campaign with some great policies. But he isn't very successful. The moderate/Red Tories crowd is with Charest. He is winning his Ontario riding, so there's that. Scott didn't run to win this leadership but to increase his profile. I feel he was ultimately successful but I sure hope for him that he gets more than 1% at the end.
I'll use other sources when I make my final projections. Still, it's probably hard to beat a dataset of over 50k donors. Sure many ridings have low numbers of observations, but this is likely the most accurate map you can create right now. If I had to guess, I'd say the fundraising might be overestimating Poilievre a bit and underestimating Charest. But this map is just another example of a metric putting Poilievre well over 50% in the first round. At this point, anyone arguing that Poilievre will need multiple rounds isn't looking at the data correctly.


